

This study aimed to identify and rank European countries based on the extent to which alcohol is culturally present, accessible, and consumed within society. The analysis incorporated a composite scoring system that blends consumption habits, public health indicators, and availability metrics.
Key Finding
Latvia is the drunkest country in Europe, where the average person has 12.6 litres of alcohol a year. The rankings are dominated by Central and Eastern European countries; Western Europe has just 2 in the top 10.
Methodology
Metrics Analyzed
To capture a multidimensional picture of alcohol engagement across Europe, we used the following key variables:

Weighting System
The normalized scores were combined to create the Alcohol Engagement Score – a final composite index scaled from 1 to 100, where 100 represents the highest level of alcohol engagement in a given country.
At 3.9%, the prevalence of having an alcohol disorder is the greatest in Poland. Europe consumes almost a quarter of the world’s total alcohol although it has less than 10% of the global population.
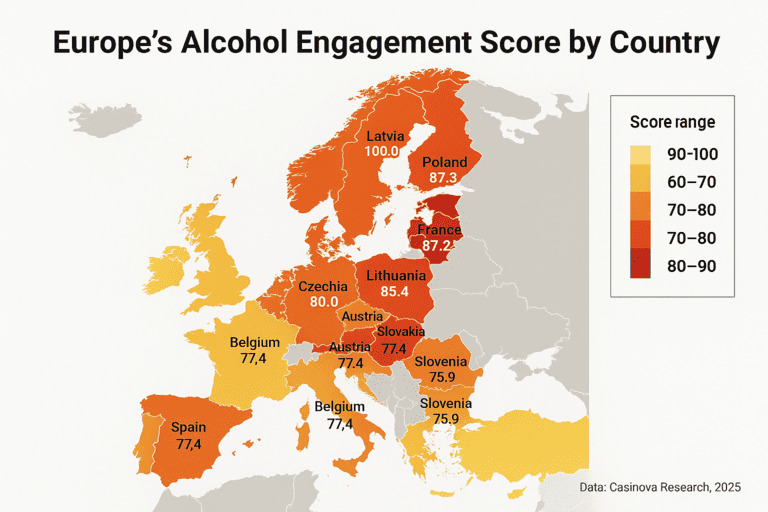
Complete Rankings
| Country | Consumption (L) | Beer Price (€) | Wine Price (€) | Disorder (%) | Bar Density | Score |
|---|---|---|---|---|---|---|
| 🇱🇻 Latvia | 12.6 | 5.00 | 7.50 | 3.4% | 0.5 | 100.0 |
| 🇵🇱 Poland | 10.8 | 3.54 | 5.89 | 3.9% | 0.4 | 87.3 |
| 🇫🇷 France | 10.4 | 7.00 | 8.00 | 2.3% | 8.1 | 87.2 |
| 🇨🇿 Czechia | 11.6 | 2.41 | 6.02 | 2.9% | 1.4 | 86.0 |
| 🇱🇹 Lithuania | 11.3 | 4.50 | 9.00 | 3.1% | 1.2 | 85.4 |
| 🇦🇹 Austria | 11.2 | 5.00 | 6.00 | 3.1% | 0.9 | 84.4 |
| 🇪🇪 Estonia | 11.1 | 5.50 | 9.00 | 2.9% | 0.8 | 80.7 |
| 🇸🇰 Slovakia | 10.5 | 2.50 | 5.00 | 2.9% | 1.6 | 77.4 |
| 🇧🇪 Belgium | 8.4 | 5.90 | 8.00 | 2.7% | 10.2 | 77.4 |
| 🇸🇮 Slovenia | 9.8 | 3.40 | 6.00 | 3.6% | 0.7 | 75.9 |
Top 10 Country Analysis
🇱🇻 Latvia
Latvia is on top with a score of 100. It is also a model of moderate pricing, with Europe’s per capita leader in alcohol consumption (12.6 liters per person, per year) also among the continent’s cheapest. 3.4% of Latvians have alcohol use disorder, one of the highest rates on the continent.
🇵🇱 Poland
Poland comes in second at 87.3. The country demonstrates a high level of alcohol consumption with 10.8 liters per capita. It is also home to some of the cheapest Europe has to offer, with beer at €3.54 and wine at €5.89.
🇫🇷 France
France holds third place with an Alcohol Consumption Score of 87.2, with pricier alcohol than nearly all the countries in the ranking. In France, there are 10.4 liters per capita and, in the capital of Paris, 332 bars—a count topped by only a few other world capitals.
🇨🇿 Czechia
Czechia scores 86.0. The country drinks 11.6 liters of alcohol per capita. One of the largest numbers of drinking establishments is in its capital city, Prague, where there are 262. It’s also home to the cheapest alcohol in the study.
🇱🇹 Lithuania
Lithuania is 5th with 11.3 liters consumed per capita and a 85.4 Alcohol Consumption Score. The Baltic nation demonstrates the party spirit in the capital city Vilnius with 120 bars, twice as many as in the comparably larger Riga.
🇦🇹 Austria
Austria secures sixth place. One of the highest in Europe (about 11.2 liters per capita), Austria’s 84.4 alcohol score explains its rank. The country’s capital, Vienna, also offers 143 venues in total.
🇪🇪 Estonia
Estonia, the third Baltic country on the list, comes in seventh with a score of 80.7. The country registers an impressive rate of alcohol consumption at 11.1 liters per capita. That is despite having the least amount of bar scene among the capitals in the top ranking.
🇸🇰 Slovakia
At number eight is Slovakia, with a score of 77.4. It has probably the cheapest wine (€5) and beer (€2.50) of all of them. Per capita consumption reaches 10.5 liters, and the capital, Bratislava, is home to 67 drinking establishments.
🇧🇪 Belgium
Sharing eighth spot on 77.4 is Belgium on the same Alcohol Consumption Score. With lower per capita consumption (8.4 liters), Belgium’s Brussels offers a fairly high bar density with 130 bars and pubs in the city.
🇸🇮 Slovenia
Slovenia rounds off the top 10 as the Balkans’ only entrant. The country’s per capita alcohol consumption is 9.8 litres and its capital, Ljubljana, has 41 bars and pubs. The Alcohol Consumption value is 75.9 in Slovenia.
Key Insights
The research reveals several important patterns in European alcohol consumption. Eastern European countries, particularly those from the former Soviet bloc, dominate the rankings with high consumption rates and relatively low prices. This suggests that historical, cultural, and economic factors play significant roles in shaping drinking habits across the continent.
Despite high consumption levels, some countries like Latvia and Estonia manage to maintain relatively controlled rates of alcohol use disorders, indicating that consumption patterns and health outcomes don’t always correlate directly. The data also highlights significant price variations across Europe, with Central and Eastern European countries offering substantially cheaper alcohol than their Western counterparts.
The study’s comprehensive approach, weighing consumption habits, health indicators, availability, and pricing, provides a nuanced view of alcohol’s role in European societies, moving beyond simple consumption statistics to understand the broader cultural and social context of drinking across the continent.